Debugging Analytics
Data validation is a critical step in the instrumentation process. Amplitude lets you validate your event data by:
- Ingestion Debugger
- User Lookup
- Instrumentation Explorer Chrome extension
Before you begin: Instrument your events
If you haven't instrumented any events, Amplitude's servers don't receive data, and no data is available in Amplitude itself. Amplitude strongly recommends that you create a test app to test and validate your first event data. See Plan your set up for more instructions and advice on getting started with Amplitude.
Ingestion debugger
Use the Ingestion Debugger in Amplitude to check your requests, events and identify counts, and throttled users or devices:
- Log in to Amplitude.
- Click on Data in the top nav bar and select Source from the left nav bar.
- Click on the Ingestion Debugger tab to access it.
The ingestion debugger is a trio of charts showing data for successful requests, events and identify counts, and error requests for the endpoints you specify. You can specify a timeframe of either one hour or one week.
Below the ingestion debugger is the list of throttled users and devices. Here you can see a list of which users and device IDs have been throttled in the last 30 minutes, as well as a list of silenced device IDs.
User lookup
Step 1: Find yourself
After you have instrumented your events, the first step is to manually fire some of those events on your own device. After you have done so, follow these steps:
- Navigate to the User Look-Up tab in the nav bar at the top of your Amplitude.
- Click on the User tab to make sure you're viewing user-level details, and not account-level details.
- Search by user ID, device ID, Amplitude ID, or user property values.

Step 2: Analyze the event stream
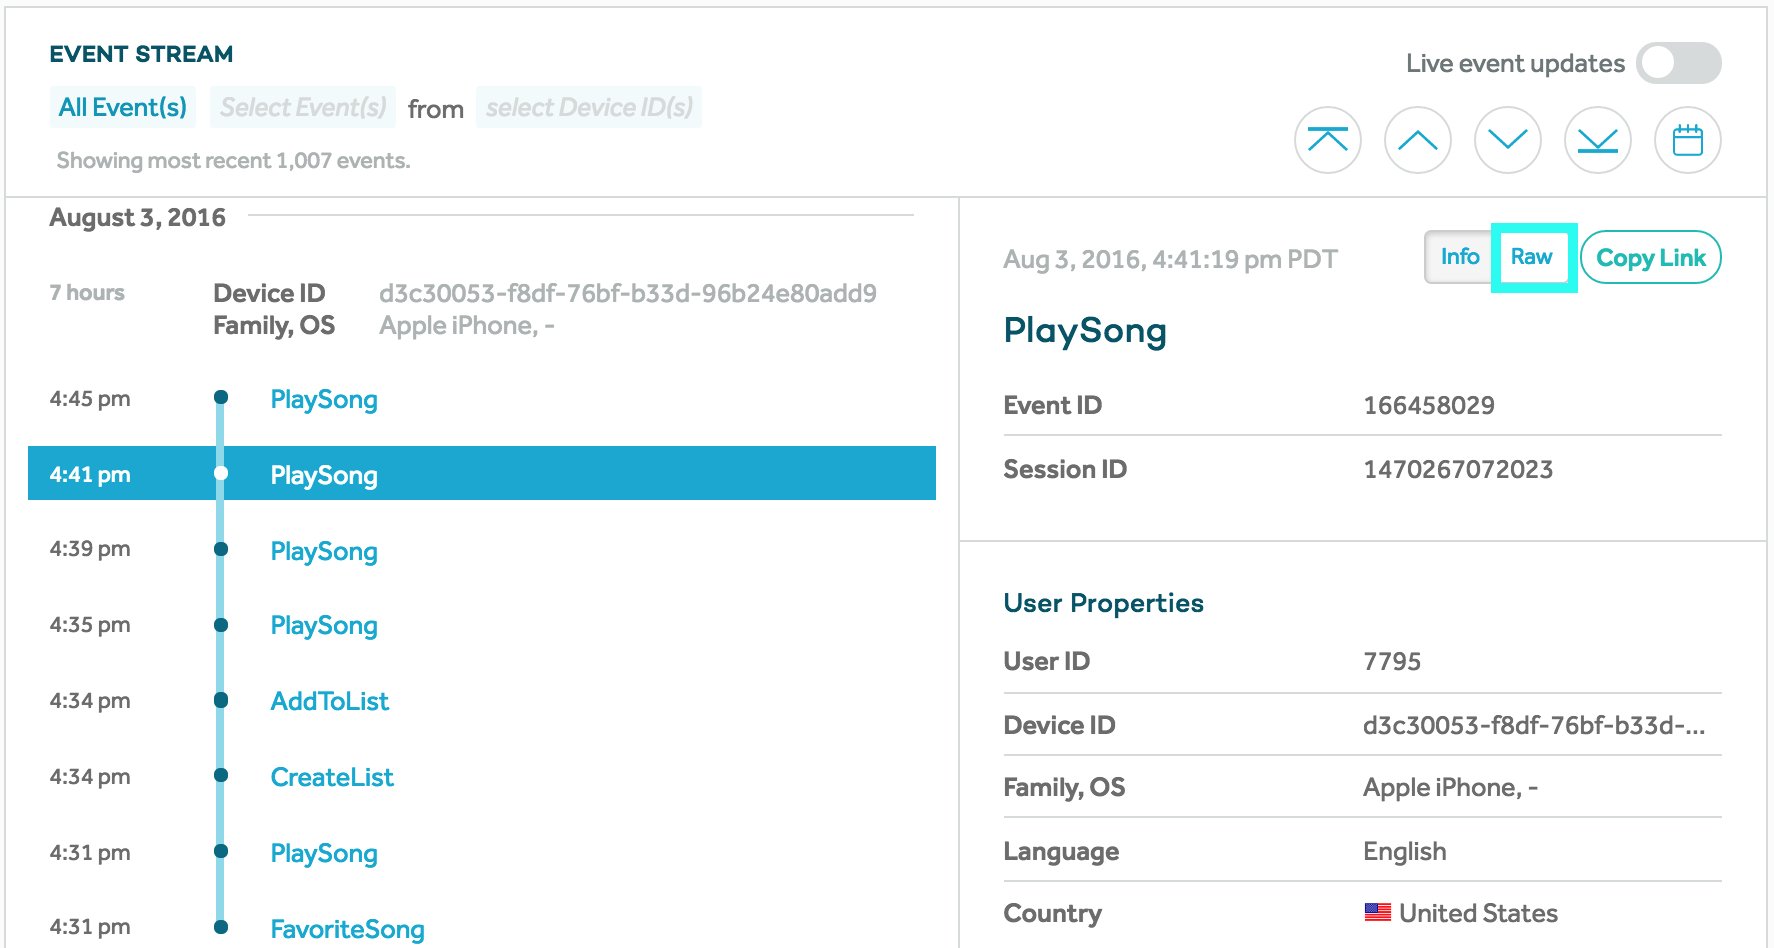
After you find your user profile, scroll down to the Event Stream section. The event stream displays a user's entire event history, grouped by session. The most recent activity appears at the top of the list, and events populate the stream in ten seconds to one minute.
Clicking on an event gives you detailed information about it, including the user property and event property values at the time of that event.
Because the event stream can update in real-time, you can use it to make sure you're capturing new events correctly, or troubleshoot or debug instrumentation errors. For example, if you trigger an event only one time but the event stream consistently displays two instances of the event, then there could be an instrumentation error.
You can view more information and the raw data of an event by clicking Raw.
Instrumentation Explorer
The Amplitude Instrumentation Explorer is an extension in the Google Chrome Web Store that helps you examine and debug your Amplitude Browser SDK instrumentation just by interacting with your product. It captures each Amplitude event you trigger and display it in the extension popup. Download it here.
View your triggered events
In the Instrumentation Explorer, the Events tab is where you can find detailed insights into the parameters of each event you trigger on your website. This includes user_id, device_id, event_properties, and user_properties.
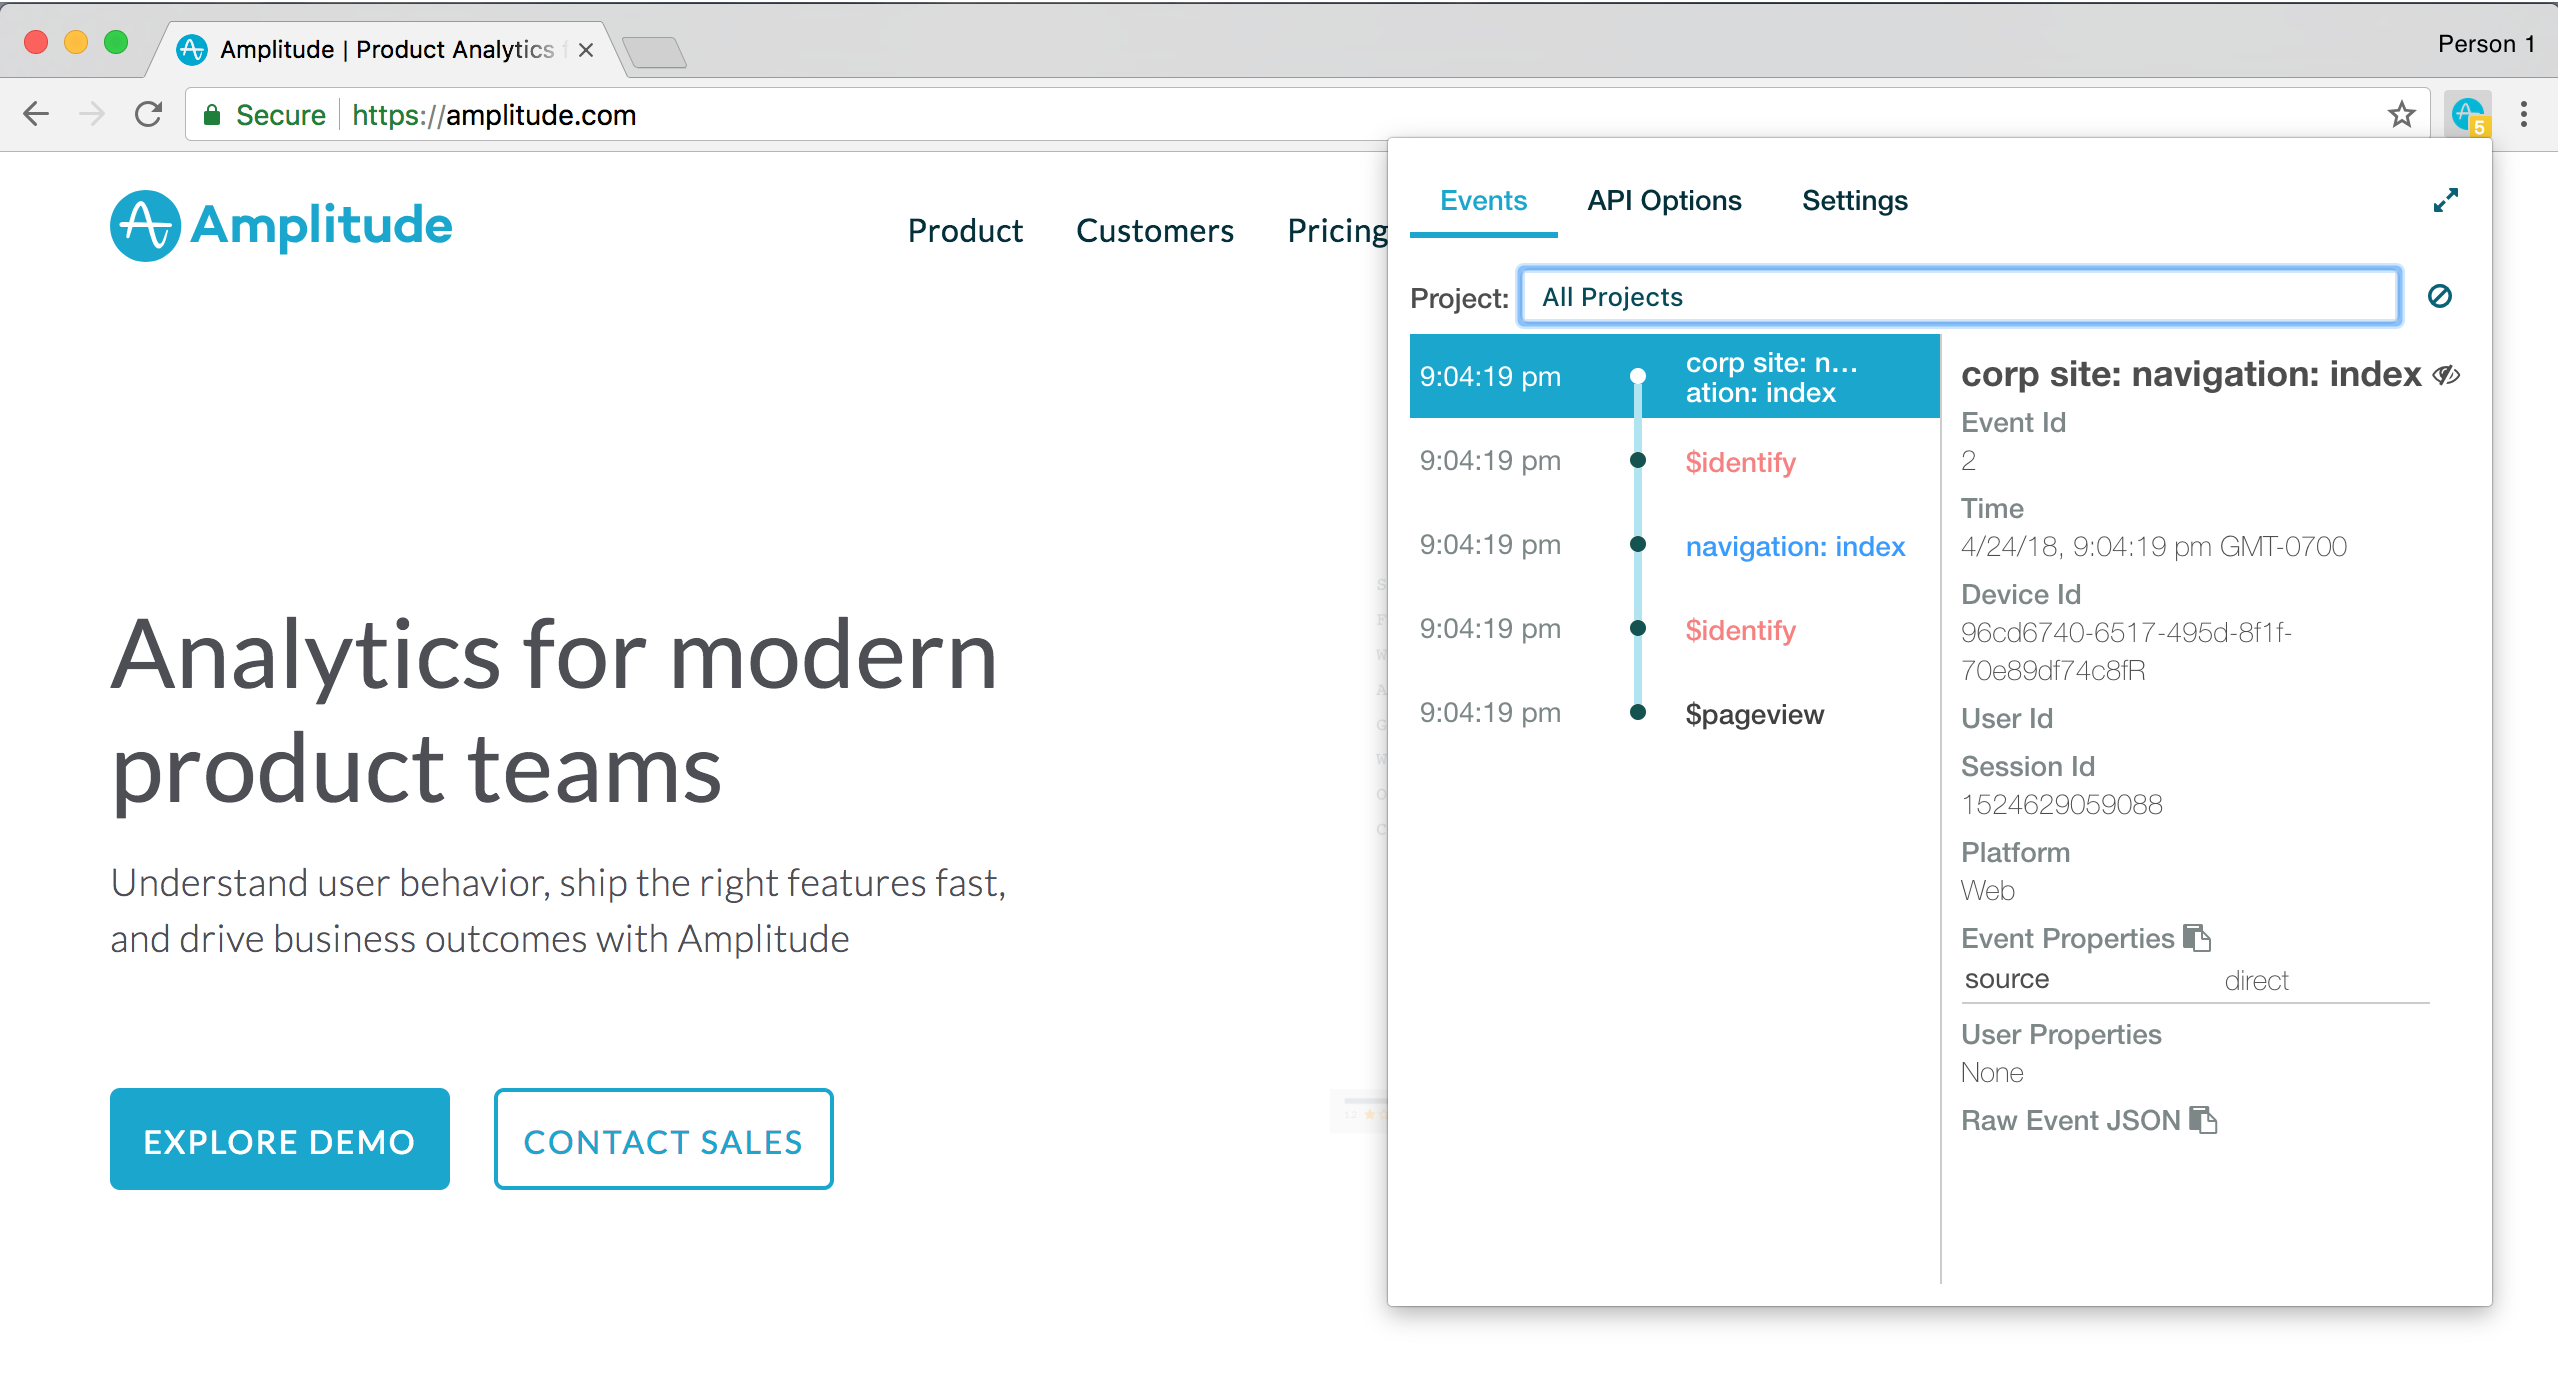
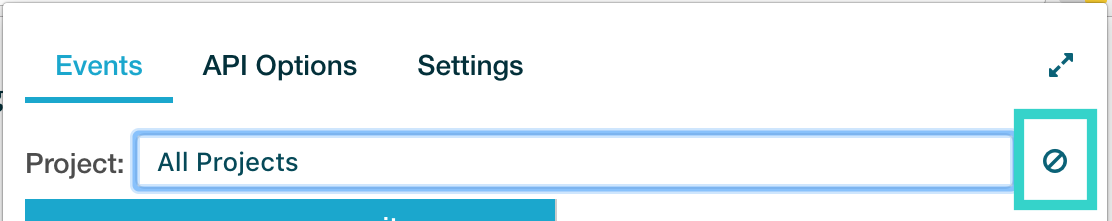
To switch between the different Amplitude projects that are receiving your events, select it from the Project dropdown. You can tell your Amplitude projects apart by their abbreviated API key:

To clear all the events from your popup, click the Forbidden icon:
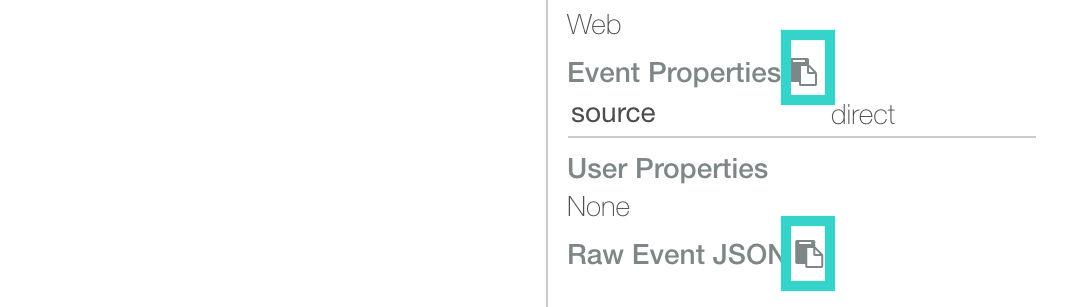
To copy your events' event and user property parameters, click the Copy icons:
View your configuration options
To view the configuration options you've set for each project's SDK, click the API Options tab:

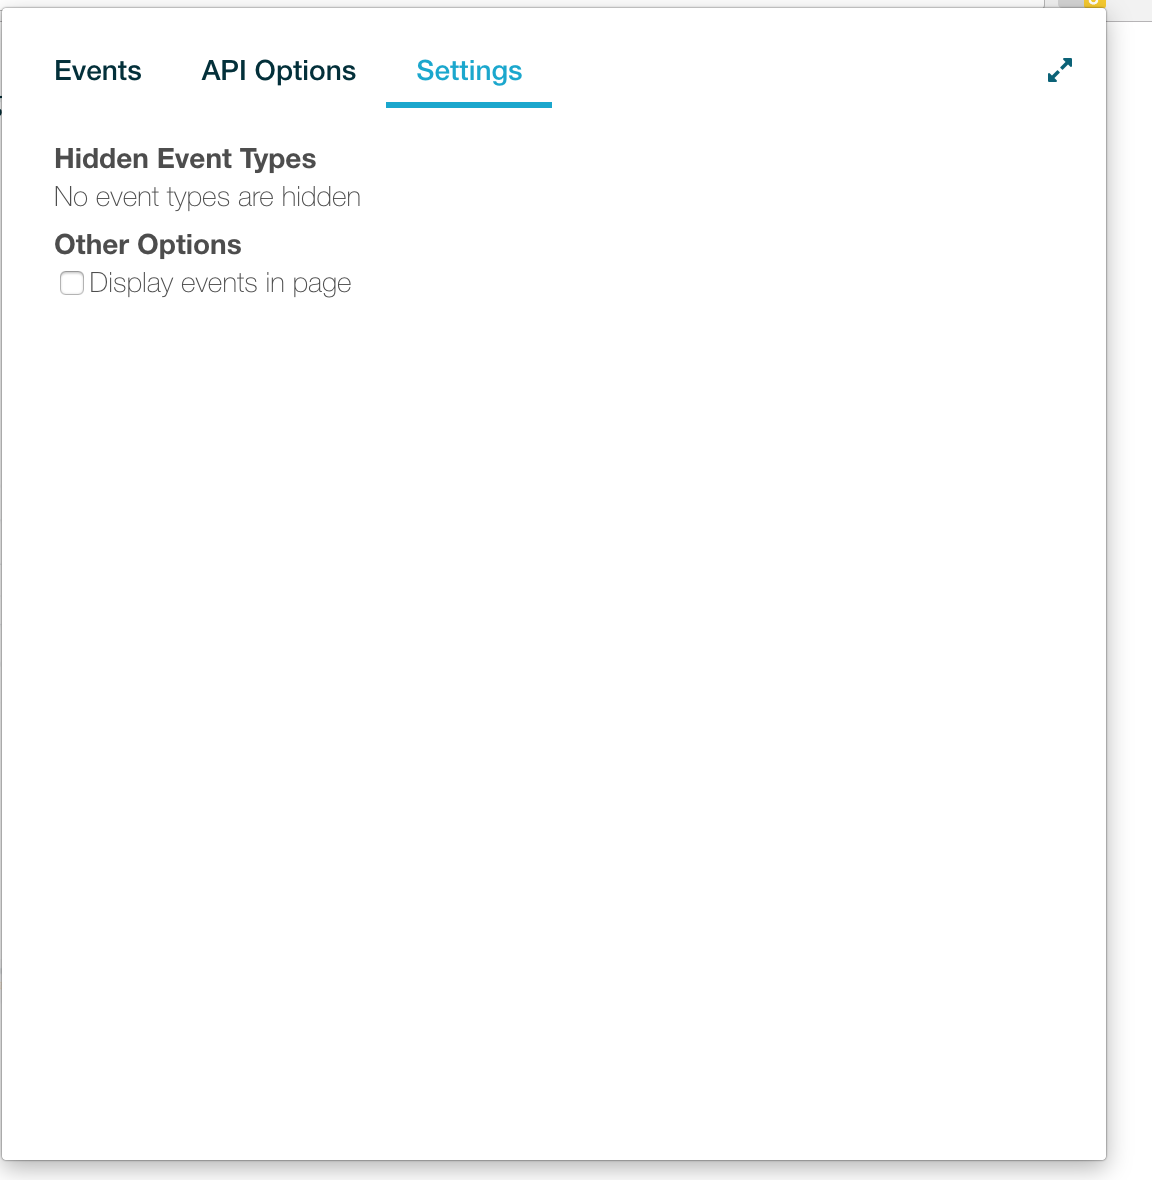
View your hidden events
To see a list of your hidden events or to display events on the webpage as they're triggered, click the Settings tab.