Dashboard REST API
You can get data that's displayed on the dashboard graphs in JSON format via the Dashboard REST API. Learn more about dashboards in the Amplitude Help Center.
Get interactive examples for this API
The Amplitude Developers Postman profile has a collection of the example requests included in this documentation, including detailed responses for each call. You don't need a Postman account to browse.
If you already use Postman, you can fork and run the collection in Postman.
Authorization
This API uses basic authentication, using the API key and secret key for your project. Pass base64-encoded credentials in the request header like {{api-key}}:{{secret-key}}. api-key replaces username, and secret-key replaces the password.
Your authorization header should look something like this:
--header 'Authorization: Basic YWhhbWwsdG9uQGFwaWdlZS5jb206bClwYXNzdzByZAo'
See Find your Amplitude Project API Credentials for help locating your credentials.
Endpoints
| Region | Endpoint |
|---|---|
| Standard Server | https://amplitude.com/api/2/ |
| EU Residency Server | https://analytics.eu.amplitude.com/api/2/ |
Considerations
- You may have to URL encode special characters in the names of event types, event properties, and user properties. For example, encode
Play SongasPlay%20Song. Use the W3Schools encoding reference for help. - Some examples in this article use backslash syntax to escape characters when using cURL. If you aren't using cURL, then don't encode your request with backslash escape characters.
- The Dashboard REST API time zone is the same as your Amplitude project's time zone.
Rate limits
For each endpoint, there is a concurrent limit and a rate limit. The concurrent limit restricts the number of requests you can run at the same time. The rate limit restricts the total number of queries you can run per hour. Exceeding these limits returns a 429 error. These limits are per project, and the 429 error also includes information on how you are exceeding the limit.
Concurrent Limit: You can run up to 5 concurrent requests across all Amplitude REST API endpoints, including cohort download.
User activity/user search limits
You can run up to 360 queries per hour for user activity and user search endpoints. The User Activity and User Search endpoints have a different rate limit than all other request types.
All other endpoints
All other endpoints use cost per query model. Amplitude calculates cost based on this formula:
cost = (# of days) * (# of conditions) * (cost for the query type)
Here is how Amplitude determines each variable in the formula:
- Number of days: This is the number of days in the query.
- Number of conditions: This is the number of segments plus the number of conditions within the segments applied to the chart you are looking at. Each group by counts as 4 segments.
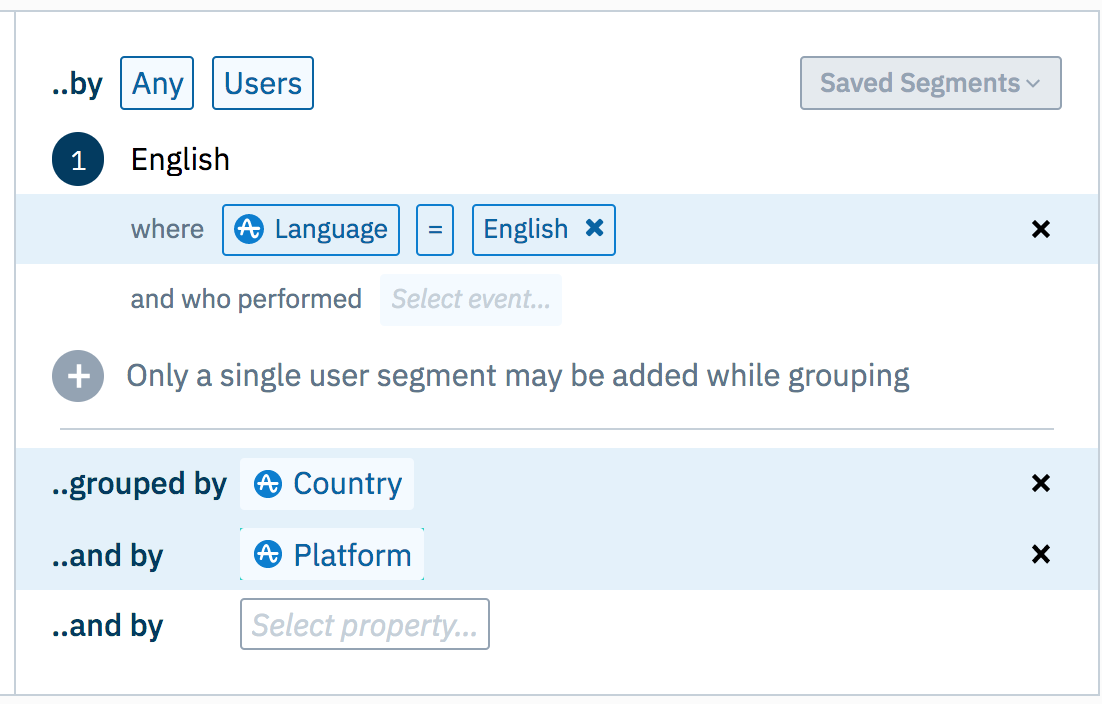
Simple query cost example
This configuration generates a cost of 10 because in has one segment (by Any Users, cost of one), one condition (Language = English, cost of one), and two group by values (Country and Platform, cost of four each) applied. Filters on events don't count in this section.
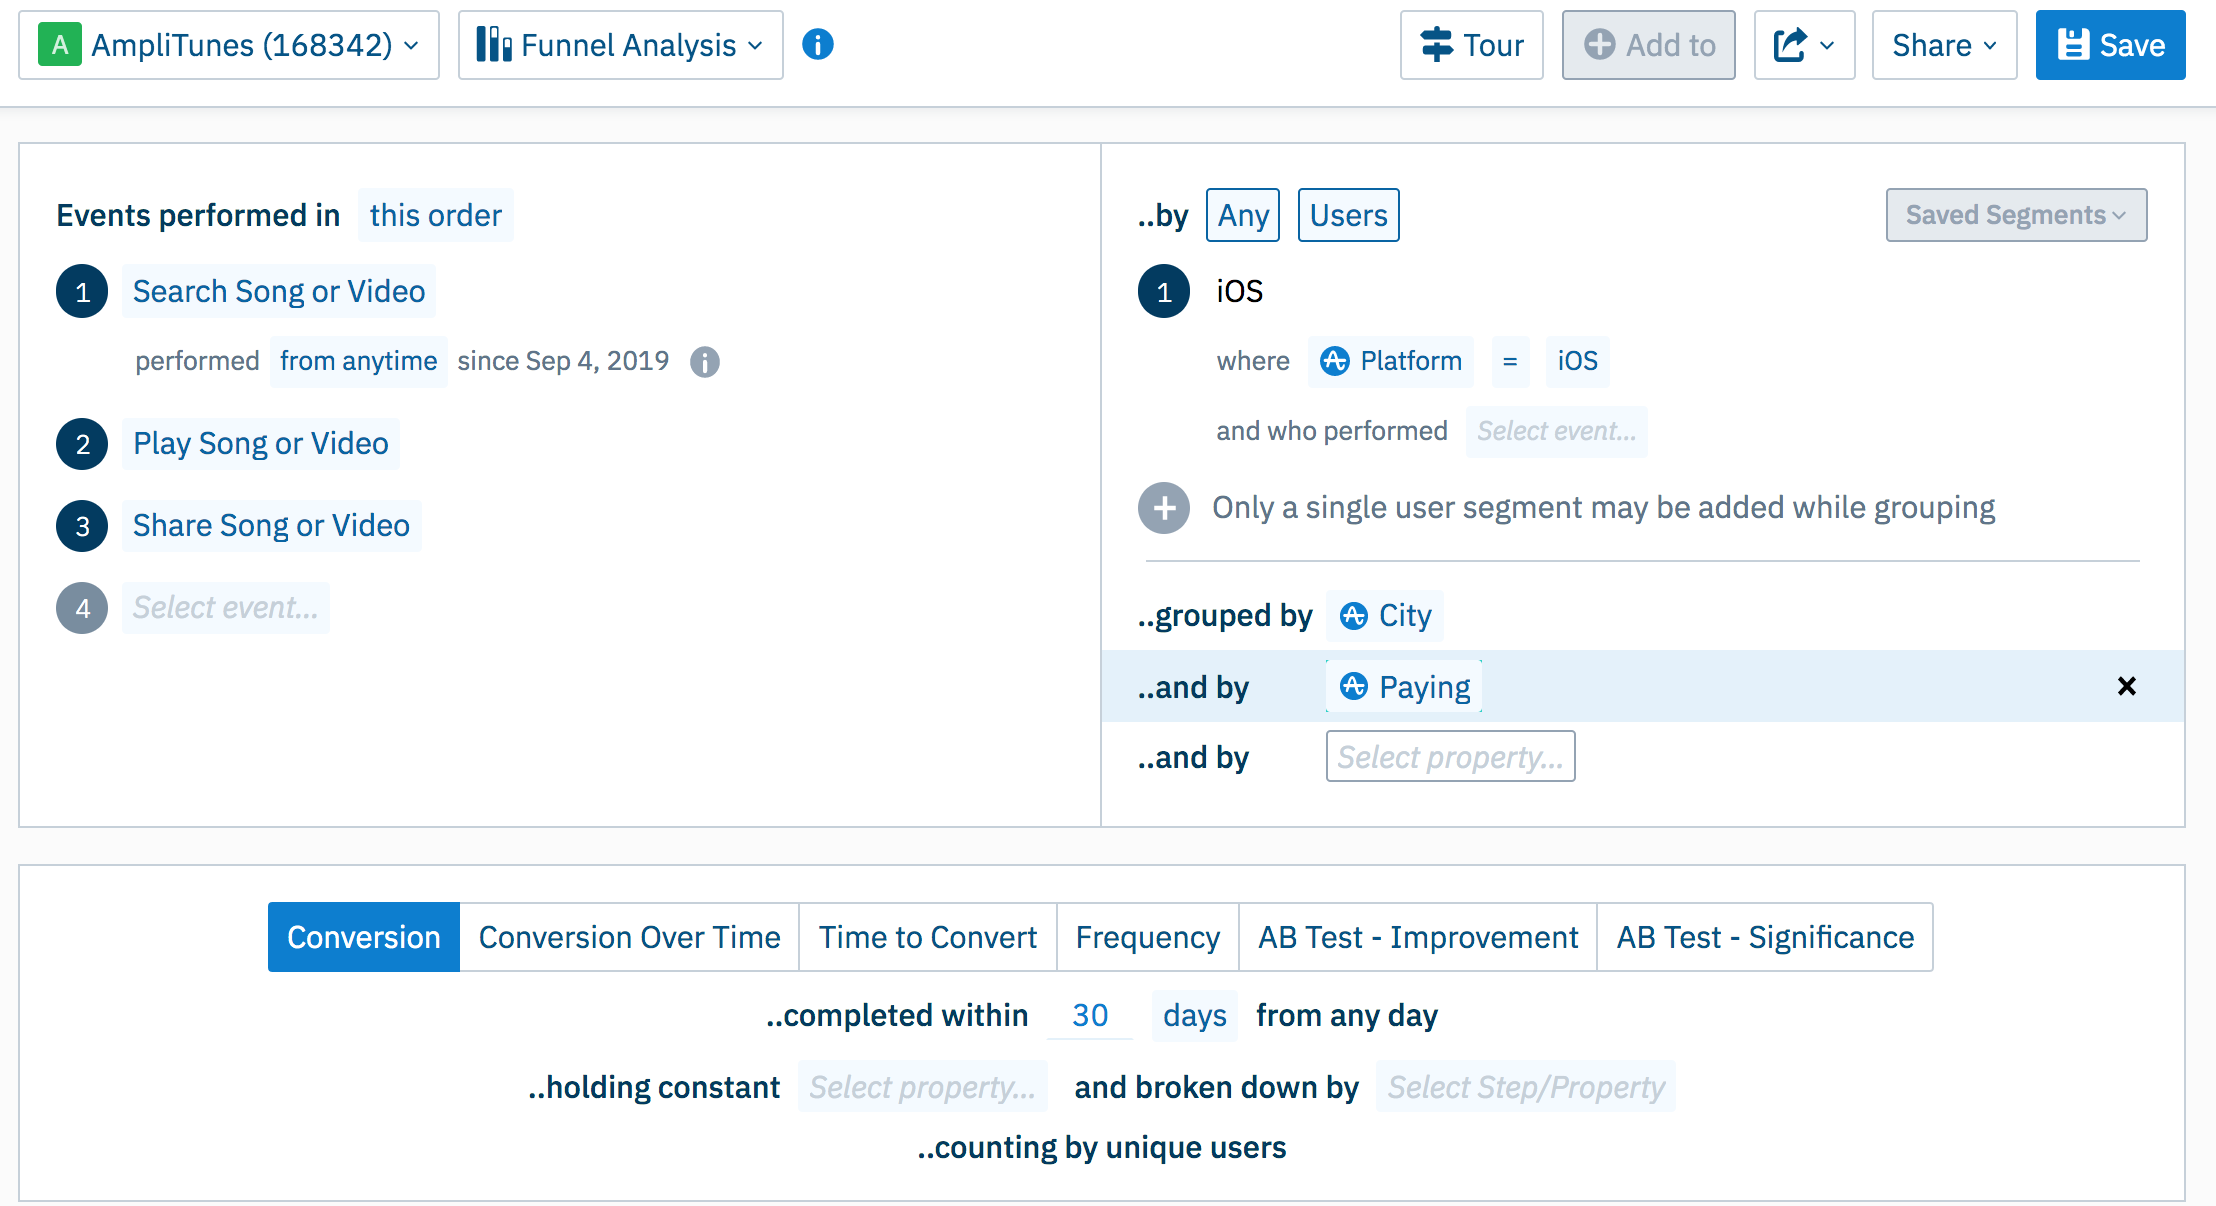
Funnel analysis cost example
This chart generates a cost of 1800. This is calculated with cost = 30 * 10 * 6.
The chart covers 30 days, one segment (Any Users, cost of one) with one condition (iOS, cost of one), two group bys (City and Paying cost of four each), multiplied by three events in the funnel (Search Song or Video, Play Song or Video, Share Song or Video; cost of six).
Different chart types have different costs. For all endpoints not listed here, the cost is 1. Here are the limits for these endpoints, measured in the cost per query:
- Concurrent Limit: Up to 1000 cost at the same time.
-
Rate Limit: Up to 108,000 cost per hour.
-
Event Segmentation: Equal to the number of events you are looking at in the left module. If any event has a group by, add a cost of 4 per group by and event.
- Funnel Analysis: The number of events you are looking at in the funnel multiplied by two. If any event has a group by, add a cost of 4 per group by and event.
- Retention Analysis: The cost for this chart is 8.
- User Sessions: The cost for this chart is 4.
Shared query parameters
These query parameters are shared across several Dashboard REST API endpoints.
Notes about query parameters
- For built-in Amplitude properties, valid values are
version,country,city,region,DMA,language,platform,os,device,device_type,start_version, andpaying. - For custom user properties, the key should be formatted as
gp:name.
| Parameter | Description |
|---|---|
e |
A full event with optional property filters or group by. Events are represented as JSON objects as described in event format. |
s |
Segment definitions. Include as many as needed. Segments are represented as JSON arrays, where each element is a JSON object corresponding to a filter condition as described segment definition. |
g |
The property to group by, for example platform. Available only when there is a single segment. Limit: two. |
Event format
The event parameter can include these keys:
Name |
Description |
|---|---|
event_type |
Required. The event type. For custom events, prefix the name with ce:. For example: "ce:name"). For '[Amplitude] Any Active Event', use _active.For '[Amplitude] Any Event', use _all. For '[Amplitude] Revenue', use revenue_amount. For '[Amplitude] Revenue (Verified)', use verified_revenue. For '[Amplitude] Revenue (Unverified)', use unverified_revenue. |
filters |
Optional. A list of property filters. Each filter is a JSON object with the following keys: subprop_type Required. Either "event" or "user", indicating that the property is either an event or user property, respectively. subprop_key Required. The name of the property to filter on. Note: For non-Amplitude, custom user properties, prepend the user property name with gp:. gp: isn't needed for event properties.subprop_op Required. The operator for filtering on specific property values, either is, is not, contains, does not contain, less, less or equal, greater, greater or equal, set is, or set is not.subprop_value: Required. A list of values to filter the event property by. |
group_by |
Optional. A list of properties to group by (at most 2). Each group by is a JSON object with these keys:type Required. - Either "event" or "user", indicating that the property is either an event or user property, respectively. value Required. - The name of the property to group by. |
Event format example
{
  "event_type": "CompletedProfile",
  "filters": [
    {
      "subprop_type": "event",
      "subprop_key": "EmailVerified",
      "subprop_op": "is",
      "subprop_value": [
        "true"
      ]
    },
    {
      "subprop_type": "user",
      "subprop_key": "gp:SignUpDate",
      "subprop_op": "is",
      "subprop_value": [
        "2021-08-18"
      ]
    }
  ],
  "group_by": [
    {
      "type": "user",
      "value": "platform"
    }
  ]
}
Segment definition
| Name | Description |
|---|---|
prop |
Required. The name of the property to filter on. For behavioral cohorts, the name of the property is "userdata_cohort". Example ("XYXxxzz" is the identifier from the Behavioral Cohort's URL, https://analytics.amplitude.com/org_name/cohort/XYXxxzz.) s=\[\{"prop":"userdata_cohort","op":"is","values":\["XYXxxzz"\]\}\] |
op |
Required. The operator for filtering on specific property values. Allowed values are is, is not, contains, does not contain, less, less or equal, greater, greater or equal, set is, or set is not. |
values |
Required. A list of values to filter the segment by. If you are segmenting by a cohort, the value is the cohort ID, found in URL of the cohort in the web app (for example, "5mjbq8w"). |
Segment definition example
[
    {
        "prop": "version",
        "op": "contains",
        "values": ["1.0", "2.0"]
    },
    {
        "prop": "gp:gender",
        "op": "is",
        "values": ["female"]
    }
]
Export data tables
You can use the Dashboard REST API to export data from data tables. Just query any Data Table chart type, and don't include start or end dates in the query.
Get results from an existing chart
Get JSON results from any saved chart via chart ID.
GET https://amplitude.com/api/3/chart/chart_id/query
Example request
GET /api/3/chart/:chart_id/query HTTP/1.1
Host: amplitude.com
Authorization: Basic {{api-key}}:{{secret-key}} #credentials must be base64 encoded
curl --location --request GET 'https://amplitude.com/api/3/chart/:chart_id/query' \
-u '{api_key}:{secret_key}'
import requests

url = "https://amplitude.com/api/3/chart/:chart_id/query"

payload={}
auth=requests.auth.HTTPBasicAuth('api-key', 'secret-key')

response = requests.request("GET", url, auth=auth, data=payload)

print(response.text)
Path variables
| Name | Description |
|---|---|
chart_id |
Required. The chart's ID. Get the chart ID from the chart's URL in the web app. For example, 'abc123' in this URL: https://analytics.amplitude.com/demo/chart/abc123). |
Response
Responses vary based on the chart's type.
Get active and new user counts
Get the number of active or new users.
GET https://amplitude.com/api/2/users
Example request
This is a basic request with only the required parameters.
curl --location --request GET 'https://amplitude.com/api/2/users?start=STARTDATE&end=ENDDATE' \
-u '{api_key}:{secret_key}'
GET /api/2/users?start=20210101&end=20210901&m=active&i=30&g=city HTTP/1.1
Host: amplitude.com
Authorization: Basic {{api-key}}:{{secret-key}} #credentials must be base64 encoded
More examples (click to expand)
Advanced user counts examples
These examples show more getting active and new user requests. Click to expand any example.
Get active users for a period
Retrieves active users between January 1 2021 and September 1 2021.
Request
curl --location --request GET 'https://amplitude.com/api/2/users?start=20210101&end=20210901&m=active'
--header 'Authorization: Basic MTIzNDU2NzgwMDoxMjM0NTY3MDA='
GET /api/2/users?start=20210101&end=20210901&m=active HTTP/1.1
Host: amplitude.com
Authorization: Basic MTIzNDU2NzgwMDoxMjM0NTY3MDA=
Response
Returns active users for the period, following the response schema for this API.
Get active users for a period, counted in an interval
Retrieves active users between January 1 2021 and September 1 2021, counted weekly.
Request
curl --location --request GET 'https://amplitude.com/api/2/users?start=20210101&end=20210901&m=active&i=7'
--header 'Authorization: Basic MTIzNDU2NzgwMDoxMjM0NTY3MDA='
GET /api/2/users?start=20210101&end=20210901&m=active&i=7 HTTP/1.1
Host: amplitude.com
Authorization: Basic MTIzNDU2NzgwMDoxMjM0NTY3MDA=
Response
Returns active users for the period grouped weekly, following the response schema for this API.
Get active users for a period, segmented by a property, counted in an interval
Retrieves active users in Amsterdam between January 1 2021 and September 1 2021, counted monthly.
Request
curl --location -g --request GET 'https://amplitude.com/api/2/users?start=20210101&end=20210901&m=active&i=30&s=[{"prop":"city","op": "is","values": ["Amsterdam"]}]'
--header 'Authorization: Basic MTIzNDU2NzgwMDoxMjM0NTY3MDA='
GET /api/2/users?start=20210101&end=20210901&m=active&i=30&s=[{"prop":"city","op": "is","values": ["Amsterdam"]}] HTTP/1.1
Host: amplitude.com
Authorization: Basic MTIzNDU2NzgwMDoxMjM0NTY3MDA=
Response
Returns active users in Amsterdam for the period counted monthly, following the response schema for this API.
Get active users for a period, grouped by a property, counted in an interval
Retrieves active users between January 1 2021 and September 1 2021, counted monthly and grouped by city.
Request
curl --location --request GET 'https://amplitude.com/api/2/users?start=20210101&end=20210901&m=active&i=30&g=city'
--header 'Authorization: Basic MTIzNDU2NzgwMDoxMjM0NTY3MDA='
GET /api/2/users?start=20210101&end=20210901&m=active&i=30&g=city HTTP/1.1
Host: amplitude.com
Authorization: Basic MTIzNDU2NzgwMDoxMjM0NTY3MDA=
Response
Returns active users for the period grouped by city, in monthly intervals, following the response schema for this API.
Get new users for a period
Retrieves new users between January 1 2021 and September 1 2021.
Request
curl --location --request GET 'https://amplitude.com/api/2/users?start=20210101&end=20210901&m=new'
--header 'Authorization: Basic MTIzNDU2NzgwMDoxMjM0NTY3MDA='
GET /api/2/users?start=20210101&end=20210901&m=new HTTP/1.1
Host: amplitude.com
Authorization: Basic MTIzNDU2NzgwMDoxMjM0NTY3MDA=
Response
Returns new users for the period, following the response schema for this API.
Query parameters
| Name | Description |
|---|---|
start |
Required. First date included in data series, formatted YYYYMMDD. For example, "20221001". |
end |
Required. Last date included in data series, formatted YYYYMMDD. For example, "20221001". |
m |
Optional. Either "new" or "active" to get the desired count. Defaults to "active". |
i |
Optional. Either 1, 7, or 30 for daily, weekly, and monthly counts, respectively. Defaults to 1. |
s |
Optional. Segment definitions. Defaults to none. Defined in Shared query parameters. |
g |
Optional. The property to group by. Defaults to none. Defined in Shared query parameters |
Response
The response is a JSON object with this schema:
Attribute |
Description |
|---|---|
series |
An array with one element for each group, in the same order as "seriesMeta", where each element is itself an array that has the value of the metric on each of the days specified in xValues. |
seriesMeta |
An array of labels with one for each segment. |
xValues |
An array of (string) dates in the form "YYYY-MM-DD", one for each date in the specified range. |
{
    "data": {
        "series": [
            [46109, 47542],
            [42845, 42626]
        ],
        "seriesMeta": ["United States", "Canada"],
        "xValues": ["2017-08-14", "2017-08-15"]
    }
}
Get session length distribution
Get the number of sessions for each pre-defined length ("bucket") period during a specified date range.
GET https://amplitude.com/api/2/sessions/length
Example request
This is a basic request with only the required parameters.
curl --location --request GET 'https://amplitude.com/api/2/sessions/length?start=STARTDATE&end=ENDDATE'
-u '{api_key}:{secret_key}'
GET /api/2/sessions/length?start=20210426&end=20210905 HTTP/1.1
Host: amplitude.com
Authorization: Basic {{api-key}}:{{secret-key}} # credentials must be base64 encoded
More examples (click to expand)
Advanced session length distribution examples
These examples show more detailed session length distribution requests. Click to expand any example.
Get session length distribution with custom bin for a period
Retrieves session length distribution from 0-10 minutes for the period between April 26 and September 5.
Request
  curl --location --request GET 'https://amplitude.com/api/2/sessions/length?start=20210426&end=20210905&timeHistogramConfigBinTimeUnit=minutes&timeHistogramConfigBinMin=0&timeHistogramConfigBinMax=10'
--header 'Authorization: Basic MTIzNDU2NzgwMDoxMjM0NTY3MDA='
GET /api/2/sessions/length?start=20210426&end=20210905&timeHistogramConfigBinTimeUnit=minutes&timeHistogramConfigBinMin=0&timeHistogramConfigBinMax=10 HTTP/1.1
Host: amplitude.com
Authorization: Basic MTIzNDU2NzgwMDoxMjM0NTY3MDA=
Response
Returns a response that follows the schema for this API.
Get session length distribution by hours with custom bin size for a period
Retrieves session length distribution with 0 - 10 hours with bucket size 2 for the period between April 26 and September 5.
Request
curl --location --request GET 'https://amplitude.com/api/2/sessions/length?start=20210426&end=20210905&timeHistogramConfigBinTimeUnit=days&timeHistogramConfigBinMin=0&timeHistogramConfigBinMax=10&timeHistogramConfigBinSize=1'
--header 'Authorization: Basic MTIzNDU2NzgwMDoxMjM0NTY3MDA='
GET /api/2/sessions/length?start=20210426&end=20210905&timeHistogramConfigBinTimeUnit=days&timeHistogramConfigBinMin=0&timeHistogramConfigBinMax=10&timeHistogramConfigBinSize=1 HTTP/1.1
Host: amplitude.com
Authorization: Basic MTIzNDU2NzgwMDoxMjM0NTY3MDA=
Response
Returns a response that follows the schema for this API.
Query parameters
Name |
Description |
|---|---|
start |
Required. First date included in data series, formatted YYYYMMDD. For example,"20221001". |
end |
Required. Last date included in data series, formatted YYYYMMDD. For example,"20221001". |
timeHistogramConfigBinTimeUnit |
Optional. Time unit for bucket sizes (see below for valid inputs). |
timeHistogramConfigBinMin |
Optional. Minimum value for bucketing, as a number. For example, "0". |
timeHistogramConfigBinMax |
Optional. Maximum value for bucketing, as a number. For example, "600". |
timeHistogramConfigBinSize |
Optional. Size of each bucket, as a number. For example, "60". |
timeHistogramConfigBin format
timeHistogramConfigBinTimeUnit is any of ['hours', 'minutes', 'seconds'].
To take advantage of custom binning, you must specify timeHistogramConfigBinMin, timeHistogramConfigBinMax, and timeHistogramConfigBinTimeUnit. When timeHistogramConfigBinSize isn't specified, Amplitude tries to find the best bin sizing. For example, if you have timeHistogramConfigBinMin=0, timeHistogramConfigBinMax=10, and timeHistogramConfigBinTimeUnit=minutes, there is no guarantee for the final number of bins or bin bounds. If timeHistogramConfigBinSize=1 is specified, then there are 10 bins, and each bin size equals a minute.
When combined timeHistogramConfigBin parameters are invalid or missing, Amplitude defaults to default bins that account for certain behaviors such as bounce rate. These bins are (in milliseconds): [0, 3000), [3000, 10,000), [10,000, 30,000), [30,000, 60,000), [60,000, 180,000), [180,000, 600,000), [600,000, 1,800,000), [1,800,000, 3,600,000), [3,600,000, 86,400,000).
Session lengths have a max length of 1 day (86,400,000 ms).
Response
The response is a JSON object with this schema:
Attribute |
Description |
|---|---|
series |
An array with one element which is itself an array that includes the counts (number of sessions) for each of the buckets. |
xValues |
An array of the (string) session length intervals (buckets) of the format [bucketStartInSeconds]s-[bucketEndInSeconds]s. |
{
   "data": {
        "series": [
             [0, 120408, 2261, 6984, 10778, 54529, 210614, 336605, 196235, 54148]
        ],
        "xValues": ["0s-60s", "60s-120s", "120s-180s", "180s-240s", "240s-300s", "300s-360s", "360s-420s", "420s-480s", "480s-540s", "540s-600s"]
    }
}
Get average session length
GET https://amplitude.com/api/2/sessions/average
Get the average session length (in seconds) for each day in the specified date range.
Example request
This request retrieves the average session length in seconds for the period between June 1 2021 and June 30 2021.
curl --location --request GET 'https://amplitude.com/api/2/sessions/average?start=20210601&end=20210630' \
-u '{api_key}:{secret_key}'
GET /api/2/sessions/average?start=20210601&end=20210630 HTTP/1.1
Host: amplitude.com
Authorization: Basic {{api-key}}:{{secret-key}} #credentials must be base64 encoded
Query parameters
| Name | Description |
|---|---|
start |
Required. First date included in data series, formatted YYYYMMDD (for example "20221001"). |
end |
Required. Last date included in data series, formatted YYYYMMDD (for example "20221004"). |
Response
Returns a JSON object with this schema:
| Attribute | Description |
|---|---|
series |
An array with one element which is itself an array that includes the average session length for each day. |
seriesMeta |
An array of labels with one for each segment. |
segmentIndex |
This represents the index of the segment, referring to its position in the right module of the chart control panel. |
xValues |
An array of (string) dates formatted like "YYYY-MM-DD" with one for each in the specified date range. |
{
    "data": {
        "series": [
            [1204.0238276716443, 1197.4160169086904],
        ],
        "seriesMeta": [
            {"segmentIndex": 0}
        ],
        "xValues": ["2017-08-14", "2017-08-15"]
    }
}
Get average sessions per user
GET https://amplitude.com/api/2/sessions/peruser
Get the average number of sessions per user on each day in the specified date range.
Example request
This example retrieves the average number of sessions per user on each day between June 1 2021 and June 30 2021.
curl --location --request GET 'https://amplitude.com/api/2/sessions/peruser?start=&end=' \
-u '{api_key}:{secret_key}'
GET /api/2/sessions/average?start=20210601&end=20210630
Host: amplitude.com
Authorization: Basic {{api-key}}:{{secret-key}}
Query parameters
| Name | Description |
|---|---|
start |
Required. First date included in data series, formatted YYYYMMDD (for example "20221001"). |
end |
Required. Last date included in data series, formatted YYYYMMDD (for example "20221004"). |
Response
Returns a JSON object with this schema:
Attribute |
Description |
|---|---|
series |
An array with one element which is itself an array that includes the (float) average number of sessions per user for each day. |
seriesMeta |
An array of labels with one for each segment. |
segmentIndex |
This represents the index of the segment, referring to its position in the right module of the chart control panel |
xValues |
An array of (string) dates formatted like "YYYY-MM-DD" with one for each in the specified date range |
{
    "data": {
        "series": [
            [3.624536794878406, 3.6232302614435854]
        ],
        "seriesMeta": [
            {"segmentIndex": 0}
        ],
        "xValues": ["2017-08-14", "2017-08-15"]
    }
}
User composition
Get the distribution of users across values of a user property in the specified date range.
GET https://amplitude.com/api/2/composition
Example request
This is a basic request.
curl --location --request GET 'https://amplitude.com/api/2/composition?start=STARTDATE&end=ENDDATE&p=PROPERTY' \
-u '{api_key}:{secret_key}'
GET /api/2/composition?start=STARTDATE&end=ENDDATE&p=property HTTP/1.1
Host: amplitude.com
Authorization: Basic {{api-key}}:{{secret-key}} # credentials must be base64 encoded
More examples (click to expand)
Advanced user composition examples
These examples show more detailed event segmentation requests. Click to expand any example.
Get user composition by property for a period
Retrieves user composition by platform between June 1 and June 30.
Request
curl --location --request GET 'https://amplitude.com/api/2/composition?start=20210601&end=20210630&p=platform'
--header 'Authorization: Basic MTIzNDU2NzgwMDoxMjM0NTY3MDA='
GET /api/2/composition?start=20210601&end=20210630&p=platform HTTP/1.1
Host: amplitude.com
Authorization: Basic MTIzNDU2NzgwMDoxMjM0NTY3MDA=
Response
Returns a response that follows the schema for this API.
Get user composition by custom property event for a period
Retrieves user composition by custom property event between June 1 and June 30.
Request
curl --location --request GET 'https://amplitude.com/api/2/composition?start=20210601&end=20210630&p=gp:event'
--header 'Authorization: Basic MTIzNDU2NzgwMDoxMjM0NTY3MDA='
GET /api/2/composition?start=20210601&end=20210630&p=gp:event HTTP/1.1
Host: amplitude.com
Authorization: Basic MTIzNDU2NzgwMDoxMjM0NTY3MDA=
Response
Returns a response that follows the schema for this API.
Query parameters
| Name | Description |
|---|---|
start |
Required. First date included in data series, formatted YYYYMMDD. For example, "20221001". |
end |
Required. Last date included in data series, formatted YYYYMMDD. For example, "20221001". |
p |
Required. The property to get the composition of. For built-in Amplitude properties, valid values are version, country, city, region, DMA, language, platform, os, device, start_version, and paying. For custom-defined user properties, format the key as gp:name. |
Response
Returns a JSON object with this schema:
Attribute |
Description |
|---|---|
series |
A one-element array which is the number of unique users who had the corresponding property value in the specified date range. |
seriesLabels |
The field that displays what user property the chart is looking at. |
xValues |
An array of values the chosen property can take on. |
{
    "data": {
        "series": [
            [69643, 47419, 38087, 19064]
        ],
        "seriesLabels": ["version"],
        "xValues": ["1.0", "(none)", "1.1", "0.2"]
     }
}
Get events list
Get the list of events with the current week's totals, uniques, and % DAU (daily active users).
GET https://amplitude.com/api/2/events/list
Example request
curl --location --request GET 'https://amplitude.com/api/2/events/list' \
-u '{api-key}:{secret-key}'
GET /api/2/events/list HTTP/1.1
Host: amplitude.com
Authorization: Basic {{api-key}}:{{secret-key}} #credentials must be base64 encoded
Response
Returns a JSON object with this schema:
Attribute |
Description |
|---|---|
non_active |
If the event is marked inactive or not. |
value |
Name of the event in the raw data. |
totals |
The total number of times the event has happened this week. |
deleted |
If the event is deleted or not. |
flow_hidden |
If the event is hidden from Pathfinder/Pathfinder Users or not. |
hidden |
If the event is hidden or not. |
display |
The display name of the event. |
{
    "data": [
        {
            "non_active": false,
            "value": "Add Content to Cart",
            "totals": 1505645,
            "deleted": false,
            "flow_hidden": false,
            "hidden": false,
            "display": "Add Content to Cart"
        },
        {
            "non_active": false,
            "value": "Add Friends",
            "totals": 193167,
            "deleted": false,
            "flow_hidden": false,
            "hidden": false,
            "display": "Add Friends"
        }
    ]
    ...
}
Event segmentation
Get metrics for an event with segmentation.
Example request
This is a basic request with only the required parameters.
curl --location --request GET 'https://amplitude.com/api/2/events/segmentation?e={"event_type":"YOUR%20EVENT"}&start=STARTDATE&end=DATE' \
-u '{api-key}:{secret-key}'
GET /api/2/events/segmentation?e={"event_type":"YOUR%20EVENT"}&start=STARTDATE&end=ENDDATE HTTP/1.1
Host: amplitude.com
Authorization: Basic {{api-key}}:{{secret-key}} #credentials must be base64 encoded
Remember that you may have to URL encode special characters in the names of event types, event properties, and user properties. For example, encode Play Song as Play%20Song.
More examples (click to expand)
Advanced event segmentation examples
These examples show more detailed event segmentation requests. Click to expand any example.
Get any active event for period
Retrieves metrics for any active event between August 1 and August 31.
Request
curl --location -g --request GET 'https://amplitude.com/api/2/events/segmentation?e={"event_type":"_active"}&start=20210801&end=20210831'
--header 'Authorization: Basic MTIzNDU2NzgwMDoxMjM0NTY3MDA='
GET /api/2/events/segmentation?e={"event_type":"_active"}&start=20210801&end=20210831 HTTP/1.1
Host: amplitude.com
Authorization: Basic MTIzNDU2NzgwMDoxMjM0NTY3MDA=
Response
Returns a response that follows the schema for this API.
Get two events between for period
Retrieves metrics for the "watch_tutorial" and "transaction" events between August 1 and August 31.
Request
curl --location -g --request GET 'https://amplitude.com/api/2/events/segmentation?e={"event_type":"watch_tutorial"}&start=20210801&end=20210802&e2={"event_type":"transaction"}'
--header 'Authorization: Basic MTIzNDU2NzgwMDoxMjM0NTY3MDA='
GET /api/2/events/segmentation?e={"event_type":"watch_tutorial"}&start=20210801&end=20210831&e2={"event_type":"transaction"} HTTP/1.1
Host: amplitude.com
Authorization: Basic MTIzNDU2NzgwMDoxMjM0NTY3MDA=
Response
Returns a response that follows the schema for this API.
Get a custom event for period
Retrieves metrics for the "My Custom Event" event between August 1 and August 31.
Request
curl --location -g --request GET 'https://amplitude.com/api/2/events/segmentation?e={"event_type":"ce:My%20Custom%20Event"}&start=20210801&end=20210831'
--header 'Authorization: Basic MTIzNDU2NzgwMDoxMjM0NTY3MDA='
GET /api/2/events/segmentation?e={"event_type":"ce:My%20Custom%20Event"}&start=20210801&end=20210831 HTTP/1.1
Host: amplitude.com
Authorization: Basic MTIzNDU2NzgwMDoxMjM0NTY3MDA=
Response
Returns a response that follows the schema for this API.
Get event totals for period
Retrieves totals for the "watch_tutorial" event between August 1 and August 31.
Request
curl --location -g --request GET 'https://amplitude.com/api/2/events/segmentation?e={"event_type":"watch_tutorial"}&start=20210801&end=20210831&m=totals'
--header 'Authorization: Basic MTIzNDU2NzgwMDoxMjM0NTY3MDA='
GET /api/2/events/segmentation?e={"event_type":"watch_tutorial"}&start=20210801&end=20210831&m=totals HTTP/1.1
Host: amplitude.com
Authorization: Basic MTIzNDU2NzgwMDoxMjM0NTY3MDA=
Response
Returns a response that follows the schema for this API.
Get event Active % for period
Retrieves daily active user (DAU) percentage for the "watch_tutorial" event between August 1 and August 31.
Request
curl --location -g --request GET 'https://amplitude.com/api/2/events/segmentation?e={"event_type":"watch_tutorial"}&start=20210801&end=20210831&m=pct_dau'
--header 'Authorization: Basic MTIzNDU2NzgwMDoxMjM0NTY3MDA='
GET /api/2/events/segmentation?e={"event_type":"watch_tutorial"}&start=20210801&end=20210831&m=pct_dau HTTP/1.1
Host: amplitude.com
Authorization: Basic MTIzNDU2NzgwMDoxMjM0NTY3MDA=
Response
Returns a response that follows the schema for this API.
Get event average for period
Retrieves averages for the "watch_tutorial" event between August 1 and August 31.
Request
curl --location -g --request GET 'https://amplitude.com/api/2/events/segmentation?e={"event_type":"watch_tutorial"}&start=20210801&end=20210831&m=average'
--header 'Authorization: Basic MTIzNDU2NzgwMDoxMjM0NTY3MDA='
GET /api/2/events/segmentation?e={"event_type":"watch_tutorial"}&start=20210801&end=20210831&m=average HTTP/1.1
Host: amplitude.com
Authorization: Basic MTIzNDU2NzgwMDoxMjM0NTY3MDA=
Response
Returns a response that follows the schema for this API.
Get event sum on price event property for period
Retrieves event sum on price event property between August 1 and August 31.
Request
curl --location -g --request GET 'https://amplitude.com/api/2/events/segmentation?e={"event_type":"watch_tutorial","group_by":[{"type":"event","value":"$price"}]}&start=20210801&end=20210831&m=sums'
--header 'Authorization: Basic MTIzNDU2NzgwMDoxMjM0NTY3MDA='
GET /api/2/events/segmentation?e={"event_type":"watch_tutorial","group_by":[{"type":"event","value":"$price"}]}&start=20210801&end=20210831&m=sums HTTP/1.1
Host: amplitude.com
Authorization: Basic MTIzNDU2NzgwMDoxMjM0NTY3MDA=
Response
Returns a response that follows the schema for this API.
Get distribution of price event property in a period
Retrieves the distribution of price event property between August 1 and August 31.
Request
curl --location -g --request GET 'https://amplitude.com/api/2/events/segmentation?e={"event_type":"watch_tutorial","group_by":[{"type":"event","value":"$price"}]}&start=20210801&end=20210831&m=sums'
--header 'Authorization: Basic MTIzNDU2NzgwMDoxMjM0NTY3MDA='
GET /api/2/events/segmentation?e={"event_type":"watch_tutorial","group_by":[{"type":"event","value":"$price"}]}&start=20210801&end=20210831&m=sums HTTP/1.1
Host: amplitude.com
Authorization: Basic MTIzNDU2NzgwMDoxMjM0NTY3MDA=
Response
Returns a response that follows the schema for this API.
Get weekly count of event in period
Retrieves weekly count of "watch_tutorial" event between August 23 and September 5.
Request
curl --location -g --request GET 'https://amplitude.com/api/2/events/segmentation?e={"event_type":"watch_tutorial"}&start=20210801&end=20210831&i=7'
--header 'Authorization: Basic MTIzNDU2NzgwMDoxMjM0NTY3MDA='
GET /api/2/events/segmentation?e={"event_type":"watch_tutorial"}&start=20210801&end=20210831&i=7 HTTP/1.1
Host: amplitude.com
Authorization: Basic MTIzNDU2NzgwMDoxMjM0NTY3MDA=
Response
Returns a response that follows the schema for this API.
Get monthly count of event grouped by property in a period
Retrieves monthly count of "watch_tutorial" event between Aug 1st and Sept 30th, grouped by user's city.
Request
curl --location -g --request GET 'https://amplitude.com/api/2/events/segmentation?e={"event_type":"watch_tutorial","group_by":[{"type":"user","value":"city"}]}&start=20210801&end=20210930&i=30'
--header 'Authorization: Basic MTIzNDU2NzgwMDoxMjM0NTY3MDA='
GET /api/2/events/segmentation?e={"event_type":"watch_tutorial","group_by":[{"type":"user","value":"city"}]}&start=20210801&end=20210930&i=30 HTTP/1.1
Host: amplitude.com
Authorization: Basic MTIzNDU2NzgwMDoxMjM0NTY3MDA=
Response
Returns a response that follows the schema for this API.
Get monthly count of event for a segment, grouped by property in a period
Retrieves monthly count of "watch_tutorial" event grouped by city property where users OS = none between August 1 and September 30.
Request
curl --location -g --request GET 'https://amplitude.com/api/2/events/segmentation?e={"event_type":"watch_tutorial","group_by":[{"type":"user","value":"city"}]}&start=20210801&end=20210930&i=30&s=[{"prop":"os","op":"is","values":["(none)"]}]'
--header 'Authorization: Basic MTIzNDU2NzgwMDoxMjM0NTY3MDA='
GET /api/2/events/segmentation?e={"event_type":"watch_tutorial","group_by":[{"type":"user","value":"city"}]}&start=20210801&end=20210930&i=30&s=[{"prop":"os","op":"is","values":["(none)"]}] HTTP/1.1
Authorization: Basic MTIzNDU2NzgwMDoxMjM0NTY3MDA=
Response
Returns a response that follows the schema for this API.
Get count of an event, filtered by segment
Retrieves daily count of "watch_tutorial" event where the user's Server Upload Time is greater or equal to 2021-08-17 between August 1 and September 30.
Request
curl --location -g --request GET 'https://amplitude.com/api/2/events/segmentation?e={"event_type":"watch_tutorial"}&start=20210801&end=20210930&s=[{"prop":"server_upload_time","op":"greater or equal","values":["2021-08-17"]}]'
--header 'Authorization: Basic MTIzNDU2NzgwMDoxMjM0NTY3MDA='
GET /api/2/events/segmentation?e={"event_type":"watch_tutorial"}&start=20210801&end=20210930&s=[{"prop":"server_upload_time","op":"greater or equal","values":["2021-08-17"]}] HTTP/1.1
Host: amplitude.com
Authorization: Basic MTIzNDU2NzgwMDoxMjM0NTY3MDA=
Response
Returns a response that follows the schema for this API.
Query parameters
Name |
Description |
|---|---|
e |
Required. Include up to two. A full event. Full description. Note: Currently, the Dashboard REST API supports segmentation by up to two events. If you wish to query on a second event, the parameter would be "e2". |
m |
Optional. Non-property metrics: uniques, totals, pct_dau, or average. Defaults to uniques. Property metrics: histogram, sums, or value_avg. To use property metrics, you must include a valid group by value in parameter e. For custom formulas: "formula" (Note: This metric only supports up to two events currently and the second event needs to have the parameter "e2"). |
n |
Optional. User type, either any or active. |
start |
Required. First date included in data series, formatted YYYYMMDD. For example, "20221001". |
end |
Required. Last date included in data series, formatted YYYYMMDD. For example, "20221001". |
i |
Set to -300000, -3600000, 1, 7, or 30 for real-time, hourly, daily, weekly, and monthly counts, respectively. Defaults to 1. Real-time segmentation displays up to 2 days of data, hourly segmentation displays up to 7 days of data, and daily displays up to 365 days of data. |
s |
Optional. Segment definitions (default: none). Full description. |
g |
Optional. Include up to two. The property to group by. Defaults to none. Full description. |
limit |
Optional. The number of Group By values returned (default: 100). The limit is 1000. |
formula |
Optional, but required if m is set to formula. If you are using the custom formula metric, you need to pass in the formula here (for example, UNIQUES(A)/UNIQUES(B)). |
rollingWindow |
Required to use a rolling window. To include a rolling window, pass in the number of days/weeks/months with which to compute a rolling window over. |
rollingAverage |
Required to use a rolling average. To include a rolling average, pass in the number of days/weeks/months with which to compute a rolling average over. |
Response
Attribute |
Description |
|---|---|
series |
An array with one element for each group, in the same order as "seriesLabels", where each element is itself an array that includes the value of the metric on each of the days specified in "xValues". |
seriesLabels |
An array of labels, one for each group. |
seriesCollapsed |
An array with one element for each group, in the same order as "seriesLabels", where each element is the value of the bar chart visualization in Event Segmentation. This value is the total unique users over a certain time interval. |
xValues |
An array of (string) dates in the form "YYYY-MM-DD", one for each date in the specified range. |
{
    "data": {
        "series": [
            [273333], [190351]
        ],
        "seriesLabels": ["United States", "Germany"],
        "seriesCollapsed": [
            [
                {"value": 273333}
            ],
            [
                {"value": 190351}
            ],
        "xValues": ["2014-10-01", "2014-10-02"]
    }
}
Funnel analysis
Get funnel drop-off and conversion rates.
GET https://amplitude.com/api/2/funnels
Example request
This is a basic request with only the required fields.
curl --location -g --request GET 'https://amplitude.com/api/2/funnels?e={"event_type":"EVENT_1"}&e={"event_type":"EVENT_2"}&start=STARTDATE&end=ENDDATE'
-u '{api_key}:{secret_key}'
GET /api/2/funnels?e={"event_type":"EVENT"}&e={"event_type":"EVENT"}&e={"event_type":"EVENT"}&start=STARTDATE&end=ENDDATE HTTP/1.1
Host: amplitude.com
Authorization: Basic {{api-key}}:{{secret-key}} #credentials must be base64 encoded
More examples (click to expand)
Advanced funnel analysis examples
These examples show more detailed funnel analysis requests. Click to expand any example.
Get event funnel for a series of events in a period, in any order with a specific conversion time
Retrieves Event funnel for "event_one" -> "event_two" -> "event_three" between August 1 to September 26 in ANY ORDER with 3 second conversion time.
Request
curl --location -g --request GET 'https://amplitude.com/api/2/funnels?e={"event_type":"event_one"}&e={"event_type":"event_two"}&e={"event_type":"event_three"}&start=20210801&end=20210926&mode=unordered&cs=3&limit=100'
--header 'Authorization: Basic MTIzNDU2NzgwMDoxMjM0NTY3MDA='
GET /api/2/funnels?e={"event_type":"event_one"}&e={"event_type":"event_two"}&e={"event_type":"event_three"}&start=20210801&end=20210926&mode=unordered&cs=3&limit=100 HTTP/1.1
Host: amplitude.com
Authorization: Basic MTIzNDU2NzgwMDoxMjM0NTY3MDA=
Response
Returns a response that follows the schema for this API.
Get event funnel for a series of events in a period, in a specific order grouped by a property
Retrieves event funnel for "event_one" -> "event_two" between August 1 to September 26 in THIS ORDER for new users where city is none grouped by custom event property called 'event'.
Request
curl --location -g --request GET 'https://amplitude.com/api/2/funnels?e={"event_type":"event_one"}&e={"event_type":"event_two"}&start=20210801&end=20210926&mode=unordered&n=new&s=[{"prop":"city","op": "is","values": ["(none)"]}]&g=gp:event'
--header 'Authorization: Basic MTIzNDU2NzgwMDoxMjM0NTY3MDA='
GET /api/2/funnels?e={"event_type":"event_one"}&e={"event_type":"event_two"}&start=20210801&end=20210926&mode=unordered&n=new&s=[{"prop":"city","op": "is","values": ["(none)"]}]&g=gp:event HTTP/1.1
Host: amplitude.com
Authorization: Basic MTIzNDU2NzgwMDoxMjM0NTY3MDA=
Response
Returns a response that follows the schema for this API.
Get event funnel for a series of events in a period, in a specific order, filtered by property, grouped by property
Retrieve event funnel for "event_one" -> "event_two" between August 1 and September 26 in THIS ORDER for new users where city is none, grouped by library.
Request
curl --location -g --request GET 'https://amplitude.com/api/2/funnels?e={"event_type":"event_one"}&e={"event_type":"event_two"}&start=20210801&end=20210926&mode=unordered&n=new&s=[{"prop":"city","op": "is","values": ["(none)"]}]&g=library'
--header 'Authorization: Basic MTIzNDU2NzgwMDoxMjM0NTY3MDA='
GET /api/2/funnels?e={"event_type":"event_one"}&e={"event_type":"event_two"}&start=20210801&end=20210926&mode=unordered&n=new&s=[{"prop":"city","op": "is","values": ["(none)"]}]&g=library HTTP/1.1
Host: amplitude.com
Authorization: Basic MTIzNDU2NzgwMDoxMjM0NTY3MDA=
Response
Returns a response that follows the schema for this API.
Get event funnel for four events in a period
Get Event funnel for "event_one" -> "event_two" -> "event_three" -> "event_four" between August 1 and September 26 in ANY ORDER.
Request
curl --location -g --request GET 'https://amplitude.com/api/2/funnels?e={"event_type":"event_one"}&e={"event_type":"event_two"}&e={"event_type":"event_three"}&e={"event_type":"event_four"}&start=20210801&end=20210926&mode=unordered'
--header 'Authorization: Basic MTIzNDU2NzgwMDoxMjM0NTY3MDA='
GET /api/2/funnels?e={"event_type":"event_one"}&e={"event_type":"event_two"}&e={"event_type":"event_three"}&e={"event_type":"event_four"}&start=20210801&end=20210926&mode=unordered HTTP/1.1
Host: amplitude.com
Authorization: Basic MTIzNDU2NzgwMDoxMjM0NTY3MDA=
Response
Returns a response that follows the schema for this API.
Get event funnel for four events in a period, for new users, unordered
Get Event funnel for "event_one" -> "event_two" -> "event_three" -> "event_four" between August 1 and September 26 in ANY ORDER, for new users.
Request
curl --location -g --request GET 'https://amplitude.com/api/2/funnels?e={"event_type":"event_one"}&e={"event_type":"event_two"}&e={"event_type":"event_three"}&e={"event_type":"event_four"}&start=20210801&end=20210926&mode=unordered'
--header 'Authorization: Basic MTIzNDU2NzgwMDoxMjM0NTY3MDA='
GET /api/2/funnels?e={"event_type":"event_one"}&e={"event_type":"event_two"}&start=20210801&end=20210926&mode=unordered&n=new&e={"event_type":"event_four"} HTTP/1.1
Host: amplitude.com
Authorization: Basic MTIzNDU2NzgwMDoxMjM0NTY3MDA=
Response
Returns a response that follows the schema for this API.
Get event funnel for four events in a period, for new users, ordered
Get Event funnel for "event_one" -> "event_two" -> "event_three" -> "event_four" between August 1 and September 26 in THIS ORDER, for new users.
Request
curl --location -g --request GET 'https://amplitude.com/api/2/funnels?e={"event_type":"event_one"}&e={"event_type":"event_two"}&e={"event_type":"event_three"}&e={"event_type":"event_four"}&start=20210801&end=20210926&mode=ordered'
--header 'Authorization: Basic MTIzNDU2NzgwMDoxMjM0NTY3MDA='
GET /api/2/funnels?e={"event_type":"event_one"}&e={"event_type":"event_two"}&start=20210801&end=20210926&mode=ordered&n=new&e={"event_type":"event_four"} HTTP/1.1
Host: amplitude.com
Authorization: Basic MTIzNDU2NzgwMDoxMjM0NTY3MDA=
Response
Returns a response that follows the schema for this API.
Query parameters
| Name | Description |
|---|---|
e |
Required. A full event for each step in the funnel. Full description |
start |
Required. First date included in data series, formatted YYYYMMDD. For example, 20221001. |
end |
Required. Last date included in data series, formatted YYYYMMDD. For example, 20221001. |
mode |
Optional. What mode to run the funnel in: ordered for events in the given order, unordered for events in any order, and sequential for events in the given order with no other events between. Defaults to ordered. |
n |
Optional. Either "new" or "active" to specify what set of users to consider in the funnel. Defaults to active. |
s |
Optional. Segment definitions. Defaults to none. Full description. |
g |
Optional. The property to group by. Defaults to none. Full description. |
cs |
Optional. The conversion window in seconds. Defaults to 2,592,000 (30 days). Conversion windows are automatically rounded down to the nearest day in "unordered" mode. |
limit |
Optional. The number of Group By values returned Defaults to 100. The maximum is 1000. |
Response
The response includes an array with one element per group. Each element has these fields:
Attribute |
Description |
|---|---|
meta |
An array of labels with one for each segment. segmentIndex This represents the index of the segment, referring to its position in the right module of the chart control panel. |
stepTransTimeDistribution |
The histogram data of each step for how long it took users to convert through that step |
stepPrevStepCountDistribution |
The histogram data for each step for how many times users performed the previous step. |
bins |
Data for one histogram bucket. start and end are the start/end of the histogram bin, the data in bin_dist is the users/count/propsum for that histogram bin. |
dayMedianTransTimes |
Median transition times by day between steps. |
series |
An array with one element for each group, where each element is itself an array that includes the median transition time between steps in milliseconds on each of the days specified in "xValues". xValues: An array of (string) dates in the form "YYYY-MM-DD", one for each date in the specified range. formattedXValues: An array of (string) dates in the form of "Month DD", one for each date in the specified range. |
dayAvgTransTimes |
Average transition times by day between steps. series An array with one element for each group, where each element is itself an array that includes the average transition time between steps in milliseconds on each of the intervals specified in "xValues". xValues An array of (string) dates in the form "YYYY-MM-DD", one for each date in the specified range. formattedXValues An array of (string) dates in the form of "Month DD", one for each date in the specified range. |
stepByStep |
An array with one element for each step of the funnel, indicating the fraction of users from the previous step who completed that step. |
medianTransTimes |
An array with one element for each step of the funnel, indicating the median transition time between steps in milliseconds. |
cumulative |
An array with one element for each step of the funnel, indicating the fraction of the total users who completed that step. |
cumulativeRaw |
An array with one element for each step of the funnel, indicating the number of users who completed that step. |
avgTransTimes |
An array with one element for each step of the funnel, indicating the average transition time between steps in milliseconds. |
dayFunnels |
Represents the number of users who completed each step of the funnel by day. series An array with one element for each group, where each element is itself an array that includes the number of users who have completed that step in the funnel on each of the intervals specified in "xValues." xValues An array of (string) dates in the form of "YYYY-MM-DD", one for each date in the specified range. formattedXValues An array of (string) dates in the form of "Month DD", one for each date in the specified range |
events |
Labels for each event in the funnel |
{
    "data": [
        {
            "meta": {"segmentIndex": 0},
            "dayMedianTransTimes": {
                "series": [
                    [0, 165548, 264380], [0, 164767, 269444]
                ],
                "xValues": ["2017-08-14", "2017-08-15"],
                "formattedXValues": ["Aug 14", "Aug 15"]
            },
            "dayAvgTransTimes": {
                "series": [
                    [0, 2294365, 5730478], [0, 2268879, 5700436]
                ],
                "xValues": ["2017-08-14", "2017-08-15"],
                "formattedXValues": ["Aug 14", "Aug 15"]
            },
            "stepByStep": [1.0, 0.9915120144246691, 0.9741139357951383],
            "medianTransTimes": [0, 166444, 270194],
            "cumulative": [1.0, 0.9915120144246691, 0.9658456707593803],
            "cumulativeRaw": [163054, 161670, 157485],
            "avgTransTimes": [0, 2175406, 5607243],
            "dayFunnels": {
                "series": [
                    [125259, 123716, 118636], [126964, 125373, 119986]
                ],
                "xValues": ["2017-08-14", "2017-08-15"],
                "formattedXValues": ["Aug 14", "Aug 15"]
            },
            "events": ["Search Song or Video", "Select Song or Video", "Play Song or Video"]
        }
    ]
}
Retention analysis
Get user retention for specific starting and returning actions.
GET https://amplitude.com/api/2/retention
Example request
This is a basic request with only the required parameters.
curl --location --request GET 'https://amplitude.com/api/2/retention?se={"event_type":"STARTEVENT"}&re={"event_type":"RETURNEVENT"}&start=STARTDATE&end=ENDDATE' \
-u '{api_key}:{secret_key}'
GET /api/2/retention?se={"event_type":"_active"}&re={"event_type":"EVENT"}&start=STARTDATE&end=ENDDATE
HTTP/1.1
Host: amplitude.com
Authorization: Basic {{api-key}}:{{secret-key}} #credentials must be base64 encoded
More examples (click to expand)
Advanced retention analysis examples
These examples show more detailed user retention analysis requests. Click to expand any example.
Get N Day retention for active event filtered by country, grouped by device ID
Retrieves the daily N-Day Retention for Any Active Event with "watch_tutorial" return where the user country is not NL or US, grouped by Device ID between August 1 and August 31.
Request
curl --location -g --request GET 'http://amplitude.com/api/2/retention?se={"event_type":"_active"}&re={"event_type":"watch_tutorial"}&start=20210801&end=20210831&s=[{"prop":"country","op": "is not","values": ["Netherlands", "United States"]}]&g=device_id'
--header 'Authorization: Basic MTIzNDU2NzgwMDoxMjM0NTY3MDA='
GET /api/2/retention?se={"event_type":"_active"}&re={"event_type":"watch_tutorial"}&start=20210801&end=20210831&s=[{"prop":"country","op": "is not","values": ["Netherlands", "United States"]}]&g=device_id HTTP/1.1
Host: amplitude.com
Authorization: Basic MTIzNDU2NzgwMDoxMjM0NTY3MDA=
Response
Returns a response as described in the schema.
Get unbounded retention for active event with another event return for a period
Retrieves unbounded Retention for Any Active Event with "watch_tutorial" return between August 1 and August 31.
Request
curl --location -g --request GET 'http://amplitude.com/api/2/retention?se={"event_type":"_active"}&re={"event_type":"watch_tutorial"}&start=20210801&end=20210831&rm=rolling'
--header 'Authorization: Basic MTIzNDU2NzgwMDoxMjM0NTY3MDA='
GET /api/2/retention?se={"event_type":"_active"}&re={"event_type":"watch_tutorial"}&start=20210801&end=20210831&rm=rolling HTTP/1.1
Host: amplitude.com
Authorization: Basic MTIzNDU2NzgwMDoxMjM0NTY3MDA=
Response
Returns a response as described in the schema.
Get weekly N-day retention for active event with another event return for a period
Retrieves weekly N-day retention for any active event with "watch_tutorial" return between July 26 and September 5.
Request
curl --location -g --request GET 'http://amplitude.com/api/2/retention?se={"event_type":"_active"}&re={"event_type":"watch_tutorial"}&start=20210726&end=20210905&i=7'
--header 'Authorization: Basic MTIzNDU2NzgwMDoxMjM0NTY3MDA='
GET /api/2/retention?se={"event_type":"_active"}&re={"event_type":"watch_tutorial"}&start=20210726&end=20210905&i=7 HTTP/1.1
Host: amplitude.com
Authorization: Basic MTIzNDU2NzgwMDoxMjM0NTY3MDA=
Response
Returns a response as described in the schema.
Get monthly N-day retention for active event with another event return for a period
Retrieves monthly N-day retention for any active event with "watch_tutorial" return between July 26 and September 5.
Request
curl --location -g --request GET 'http://amplitude.com/api/2/retention?se={"event_type":"_active"}&re={"event_type":"watch_tutorial"}&start=20210726&end=20210905&i=30'
--header 'Authorization: Basic MTIzNDU2NzgwMDoxMjM0NTY3MDA='
GET /api/2/retention?se={"event_type":"_active"}&re={"event_type":"watch_tutorial"}&start=20210726&end=20210905&i=30 HTTP/1.1
Host: amplitude.com
Authorization: Basic MTIzNDU2NzgwMDoxMjM0NTY3MDA=
Response
Returns a response as described in the schema.
Query parameters
| Parameter | Description |
|---|---|
se |
Required. Full event for the start action. Supports two event_type values: _new for new users, and _active for all users. |
re |
Required. Full event for the returning action. Supports one event_type value: _all for all events and _active for all active events. |
start |
Required. First date included in data series, formatted YYYYMMDD. For example, "20221001". |
end |
Required. Last date included in data series, formatted YYYYMMDD. For example, "20221001". |
rm |
Optional. The retention type: bracket, rolling, or n-day. Note that rolling implies unbounded retention. Defaults to n-day, no need to call it explicitly. |
rb |
Optional, but required if rm is set to bracket. The days within each bracket, formatted [[0,4]]. For example, if your bracket was Day 0 - Day 4, the parameter value would be [[0,5]]. |
i |
Optional. Either 1, 7, or 30 for daily, weekly, and monthly counts, respectively. Defaults to 1. |
s |
Optional. Segment definitions. Defaults to none. Full description. |
g |
Optional. Limit: one. The property to group by. Defaults to none. Full description. |
Response
Attribute |
Description |
|---|---|
series |
A JSON object containing two keys. dates - An array of formatted string dates, one for each date in the specified range (in descending order). values - A JSON object with one key for each date, where each value is an array whose n-th element corresponds to the retention for n intervals (days, weeks, or months depending on i) out. This is by each interval. |
count |
The number of users retained in that interval. |
outof |
The total number of users in the cohort (users who performed the starting action on the date), respectively. |
incomplete |
Whether users in that date have had enough time to be retained. |
combined |
A JSON object where each value is an array whose n-th element corresponds to the retention for n intervals (days, weeks, or months depending on i) out. This object is the deduplicated aggregate of all date cohorts from the values JSON object. |
seriesMeta |
An array of labels with one for each segment. |
segmentIndex |
This represents the index of the segment, referring to its position in the right module of the chart control panel. |
eventIndex |
This represents the index of the event, referring to which event if you have many return events selected in the left module. |
{
    "data": {
        "series": [
            {
                "dates": ["Aug 15", "Aug 14"],
                "values": {
                    "Aug 14": [
                        {"count": 12864, "outof": 12864, "incomplete": false}, {"count": 9061, "outof": 12864, "incomplete": false}, ..., {"count": 1561, "outof": 12864, "incomplete": true}
                    ],
                    "Aug 15": [
                        {"count": 14720, "outof": 14720, "incomplete": false}, {"count": 10249, "outof": 14720, "incomplete": false}, ..., {"count": 1773, "outof": 14720, "incomplete": true}
                    ],
                },
                "combined": [
                    {"count": 27584, "outof": 27584, "retainedSetId": null, "incomplete": false},
                    {"count": 19310, "outof": 27584, "retainedSetId": null, "incomplete": false},
                    ...
                    {"count": 1561, "outof": 12864, "retainedSetId": null, "incomplete": true}
                ]
            },
        "seriesMeta": [
            {"segmentIndex": 0, "eventIndex": 0}
        ]
    }
}
User activity
Get a user summary and their most (or least) recent events. Exceeding the request limits results in 429 errors.
GET https://amplitude.com/api/2/useractivity
Example request
This is a basic example with only the required parameters.
    curl --location --request GET 'https://amplitude.com/api/2/useractivity?user={amplitude_id}'
    -u '{api_key}:{secret_key}'
GET /api/2/useractivity?user=247246881751 HTTP/1.1
Host: amplitude.com
Authorization: Basic {{api-key}}:{{secret-key}} #credentials must be base64 encoded
More examples (click to expand)
Advanced user activity examples
These examples show more detailed user activity requests. Click to expand any example.
Get events for user with ID 123
Request
curl --location --request GET 'https://amplitude.com/api/2/useractivity?user=123'
--header 'Authorization: Basic MTIzNDU2NzgwMDoxMjM0NTY3MDA='
GET /api/2/useractivity?user=123 HTTP/1.1
Host: amplitude.com
Authorization: Basic MTIzNDU2NzgwMDoxMjM0NTY3MDA=
Response
Returns a list of user 123's events as described in the response schema.
Get up to 100 events for user with ID 123, offset from the 50th event
Request
curl --location --request GET 'https://amplitude.com/api/2/useractivity?user=123&offset=49&limit=100' \
--header 'Authorization: Basic MTIzNDU2NzgwMDoxMjM0NTY3MDA='
GET /api/2/useractivity?user=123&offset=49&limit=100 HTTP/1.1
Host: amplitude.com
Authorization: Basic MTIzNDU2NzgwMDoxMjM0NTY3MDA=
Response
Returns a list of up to 100 of user 123's events, offset from the 50th most recent event.
Get most recent two events for user with ID 123
Request
Limits are indexed from 0, so notice that the request has a limit of 1 to return the two most recent events.
curl --location --request GET 'https://amplitude.com/api/2/useractivity?user=123&limit=1' \
--header 'Authorization: Basic MTIzNDU2NzgwMDoxMjM0NTY3MDA='
GET /api/2/useractivity?user=123&limit=1 HTTP/1.1
Host: amplitude.com
Authorization: Basic MTIzNDU2NzgwMDoxMjM0NTY3MDA=
Response
Returns user 123's most recent 2 events.
Query parameters
| Name | Description |
|---|---|
user |
Required. Amplitude ID of the user. |
offset |
Optional. Zero-indexed (from most recent event) offset to start returning events from. |
limit |
Optional. Number of events to return (up to 1000). Note that more events may be returned so that there are no partial sessions. Defaults to 1000. |
direction |
Optional. "earliest" to include the user's earliest event or "latest" to includes the most recent. Defaults to "latest". |
Response
The response is a JSON object with this schema:
| Attribute | Description |
|---|---|
events |
An array of JSON objects, one for each event performed by the user. |
userData |
Total statistics about the user and their user properties. |
Example JSON response (click to expand)
{
    "userData": {
        "user_id": "myusername",
        "canonical_amplitude_id": 12345,
        "merged_amplitude_ids": [11111, 22222],
        "num_events": 142,
        "num_sessions": 23,
        "usage_time": 2570259,
        "first_used": "2015-03-14",
        "last_used": "2015-04-22",
        "purchases": 2,
        "revenue": 9.98,
        "platform": "iOS",
        "os": "ios 8.2",
        "version": "3.4.9",
        "device": "Apple iPhone",
        "device_type": "Apple iPhone 6",
        "carrier": "AT&T",
        "country": "United States",
        "region": "California",
        "city": "San Francisco",
        "dma": "San Francisco-Oakland-San Jose, CA",
        "language": "English",
        "start_version": "1.2.3",
        "device_ids": ["some-device", "some-other-device"],
        "last_location": {
            "lat": 37.133,
            "lng": -122.241
        },
        "properties": {
            "gender": "female"
        }
    },
    "events": [...]
}
User search
Search for a user with a specified Amplitude ID, device ID, user ID, or user ID prefix. Exceeding the request limits results in 429 errors.
GET https://amplitude.com/api/2/usersearch
Example request
curl --location --request GET 'https://amplitude.com/api/2/usersearch?user=USER_ID' \
-u '{api-key}:{secret-key}'
GET /api/2/usersearch?user=user_id HTTP/1.1
Host: amplitude.com
Authorization: Basic {{api-key}}:{{secret-key}} #credentials must be base64 encoded
More examples (click to expand)
Advanced user search examples
These examples show more detailed user search requests. Click to expand any example.
Search for user by device ID
Search for user with the device ID 0786zXEdyOX1rS3M-P_m1d.
Request
curl --location --request GET 'https://amplitude.com/api/2/usersearch?user=0786zXEdyOX1rS3M-P_m1d'
--header 'Authorization: Basic MTIzNDU2NzgwMDoxMjM0NTY3MDA='
GET /api/2/usersearch?user=0786zXEdyOX1rS3M-P_m1d HTTP/1.1
Host: amplitude.com
Authorization: Basic MTIzNDU2NzgwMDoxMjM0NTY3MDA=
import requests

url = "https://amplitude.com/api/2/usersearch?user=0786zXEdyOX1rS3M-P_m1d"

payload={}
headers = {
  'Authorization': 'Basic MTIzNDU2NzgwMDoxMjM0NTY3MDA='
}

response = requests.request("GET", url, headers=headers, data=payload)

print(response.text)
Response
This request returns the following:
{
    "type": "match_user_or_device_id",
    "matches": [
        {
            "user_id": null,
            "amplitude_id": 356896327775,
            "last_device_id": "0786zXEdyOX1rS3M-P_m1d",
            "platform": "Web",
            "country": "United States",
            "last_seen": "2022-02-01"
        }
    ]
}
Search for user by Amplitude ID
Search for the user with Amplitude ID 356893043036.
Request
curl --location --request GET 'https://amplitude.com/api/2/usersearch?user=356893043036'
--header 'Authorization: Basic MTIzNDU2NzgwMDoxMjM0NTY3MDA='
GET /api/2/usersearch?user=356893043036 HTTP/1.1
Host: amplitude.com
Authorization: Basic MTIzNDU2NzgwMDoxMjM0NTY3MDA=
Response
{
    "type": "match_amplitude_id",
    "matches": [
        {
            "user_id": null,
            "amplitude_id": 356893043036,
            "last_device_id": "XIYp6uKHkPD4dysiZHt-0p",
            "platform": "Web",
            "country": "United States",
            "last_seen": "2022-02-01"
        }
    ]
}
Query parameters
| Name | Description |
|---|---|
user |
Required. Amplitude ID, Device ID, User ID, or User ID prefix. |
Response
| Attribute | Description |
|---|---|
matches |
An array of JSON objects, one for each matching user containing their Amplitude ID and User ID. |
type |
Which match type (Amplitude ID, Device ID, User ID, User ID prefix) yielded the result. |
{
    "matches": [
        {
            "user_id": "myusername",
            "amplitude_id": 12345
        }
    ],
    "type": "match_user_or_device_id"
}
If there are no matches, the response returns a 200 response with the following body:
{
    "type": "nomatch",
    "matches": []
}
Real-time active users
Get active user numbers with 5-minute granularity for the last two days.
GET https://amplitude.com/api/2/realtime
Example request
curl --location --request GET 'https://amplitude.com/api/2/realtime' \
-u '{api-key}:{secret-key}'
GET /api/2/realtime?i=5 HTTP/1.1
Host: amplitude.com
Authorization: Basic {{api-key}}:{{secret-key}} #credentials must be base64 encoded
Response
Returns a JSON object with this schema:
Attribute |
Description |
|---|---|
xValues |
An array of (string) times in the form "HH:mm", one for each time interval in a day starting from the current time. |
seriesLabels |
An array of two labels: "Today" and "Yesterday". |
series |
An array with one element for each group, in the same order as "seriesLabels", where each element is itself an array that includes the value of the metric on each of the days specified in "xValues". |
{
    "data": {
        "xValues": ["15:00", "15:05", "15:10", ... ],
        "seriesLabels": ["Today", "Yesterday"],
        "series": [
            [123, 144, 101, ...],
            [139, 111, 180, ...]
        ]
    }
}
Revenue lifetime value (LTV)
Get the lifetime value of new users.
GET https://amplitude.com/api/2/revenue/ltv
Learn more about this chart in the Help Center.
Example request
curl --location --request GET 'https://amplitude.com/api/2/revenue/ltv?start=&end=' \
-u '{api-key}:{secret-key}'
GET /api/2/revenue/ltv?start=STARTDATE&end=ENDDATE HTTP/1.1
Host: amplitude.com
Authorization: Basic {{api-key}}:{{secret-key}} #credentials must be base64 encoded
More examples (click to expand)
Advanced revenue LTV examples
These examples show more detailed revenue LTV requests. Click to expand any example.
LTV aggregated weekly
Request
Requests LTV between December 1 2021 and December 31 2021, aggregated weekly.
curl --location --request GET 'https://amplitude.com/api/2/revenue/ltv?start=20211201&end=20211231&i=7' \
--header 'Authorization: Basic MTIzNDU2NzgwMDoxMjM0NTY3MDA='
GET /api/2/revenue/ltv?start=20211201&end=20211231&i=7 HTTP/1.1
Host: amplitude.com
Authorization: Basic MTIzNDU2NzgwMDoxMjM0NTY3MDA=
package main

import (
  "fmt"
  "net/http"
  "io/ioutil"
)

func main() {

  url := "https://amplitude.com/api/2/revenue/ltv?start=20211201&end=20211231&i=7"
  method := "GET"

  client := &http.Client {
  }
  req, err := http.NewRequest(method, url, nil)

  if err != nil {
    fmt.Println(err)
    return
  }
  req.Header.Add("Authorization", "Basic MTIzNDU2NzgwMDoxMjM0NTY3MDA=")

  res, err := client.Do(req)
  if err != nil {
    fmt.Println(err)
    return
  }
  defer res.Body.Close()

  body, err := ioutil.ReadAll(res.Body)
  if err != nil {
    fmt.Println(err)
    return
  }
  fmt.Println(string(body))
}
Response
The response follows the response schema described previously.
LTV aggregated monthly for new paying users
This example pulls LTV for the year, counted monthly for new paying users.
Request
curl --location --request GET 'https://amplitude.com/api/2/revenue/ltv?start=20211201&end=20221231&m=3&i=30' \
--header 'Authorization: Basic MTIzNDU2NzgwMDoxMjM0NTY3MDA='
GET /api/2/revenue/ltv?start=20211201&end=20221231&m=3&i=30 HTTP/1.1
Host: amplitude.com
Authorization: Basic MTIzNDU2NzgwMDoxMjM0NTY3MDA=
import requests

url = "https://amplitude.com/api/2/revenue/ltv?start=20211201&end=20221231&m=3&i=30"

payload={}
headers = {
  'Authorization': 'Basic MTIzNDU2NzgwMDoxMjM0NTY3MDA='
}

response = requests.request("GET", url, headers=headers, data=payload)

print(response.text)
Response
The response follows the response schema described previously.
Query parameters
| Parameter | Description |
|---|---|
m |
Optional. One of the following metrics: 0 = average revenue per user (ARPU), 1 = average realized revenue per user (ARPPU), 2 = Total Revenue, 3 = Paying Users. Defaults to 0. |
start |
Required. First date included in data series, formatted YYYYMMDD. For example, "20221001". |
end |
Required. Last date included in data series, formatted YYYYMMDD. For example, "20221001". |
i |
Optional. Either 1, 7, or 30 for daily, weekly, and monthly counts, respectively. Defaults to 1. |
s |
Optional. Segment definitions. Defaults to none. Full description. |
g |
Optional. Limit: one. The property to group by. Defaults to none. Full description. |
Response
Returns a response containing JSON objects with this schema:
Attribute |
Description |
|---|---|
seriesLabels |
An array of labels, one for each group. |
series |
A JSON object containing two keys. dates - An array of formatted string dates, one for each date in the specified range (in descending order). values - A JSON object with one key for each date, where each value is a JSON object with keys r1d, r2d, ..., r90d for the n-day metric values, and the keys count, paid, and total_amount, which indicate the total number of users, number of paid users, and amount paid by the users for the group. |
{
    "data": {
        "seriesLabels": [""],
        "series": [
            {
                "dates": ["2021-10-04", "2021-10-03", "2021-10-02", "2021-10-01"],
                "values": {
                    "2014-10-01": {
                        "r1d": 9.99,
                        "r2d": 19.98,
                        ...
                        "r90d": 742.52,
                        "count": 110,
                        "paid": 37,
                        "total_amount": 781.39
                    },
                    ...
                }
            }
        ]
    }
}